

UptickSales Analytics Dashboard, a FlutterFlow template
Get it now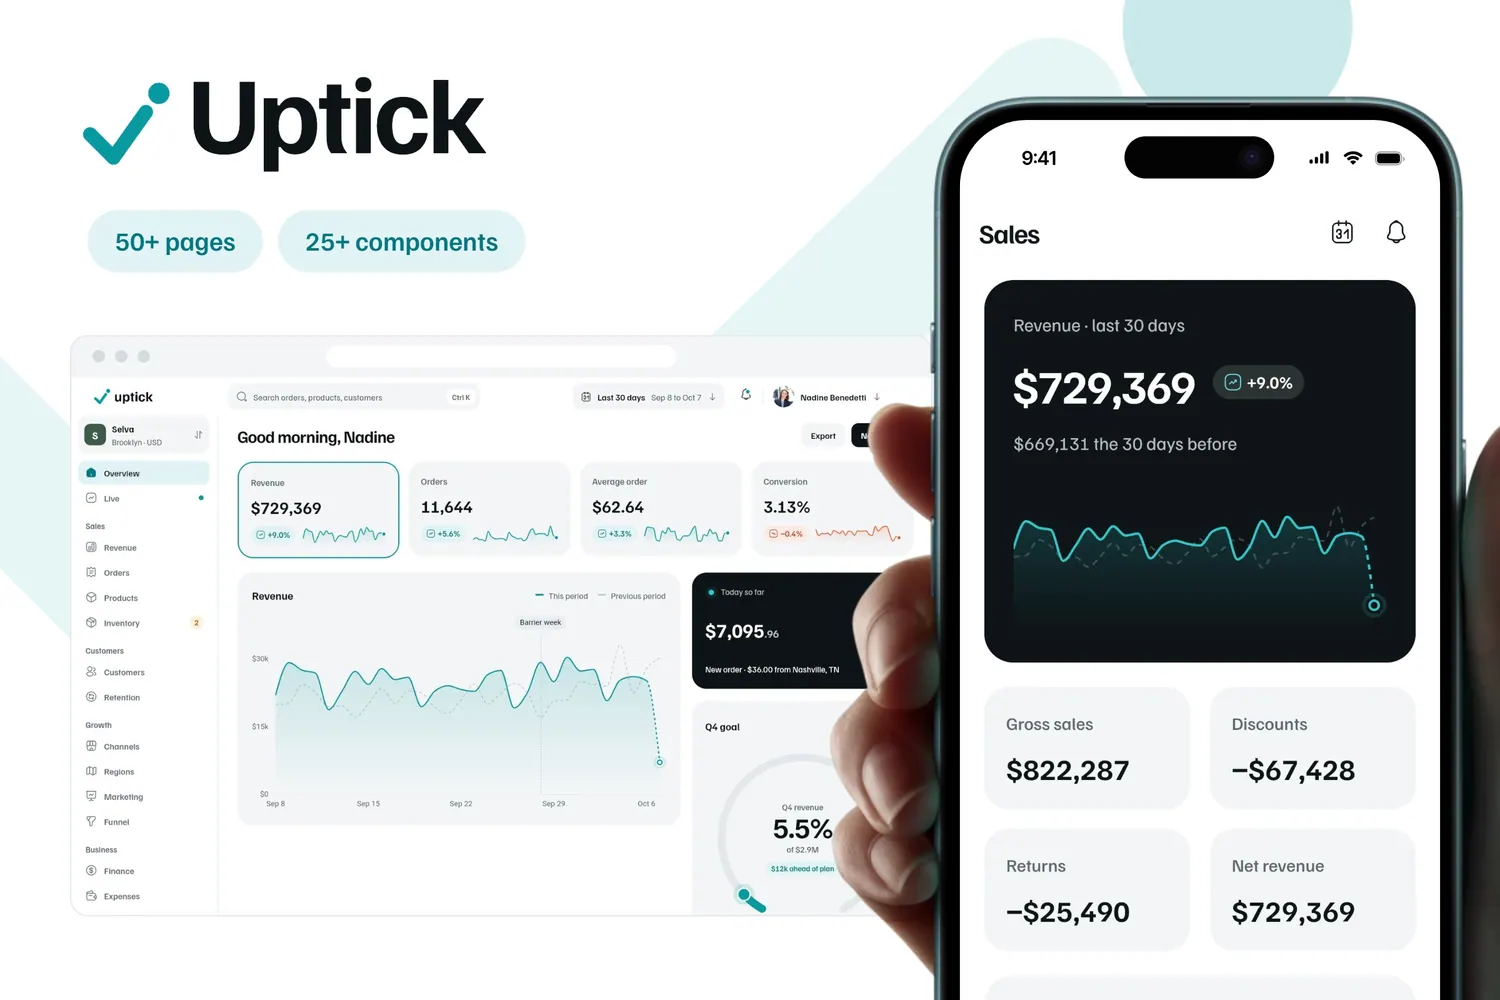
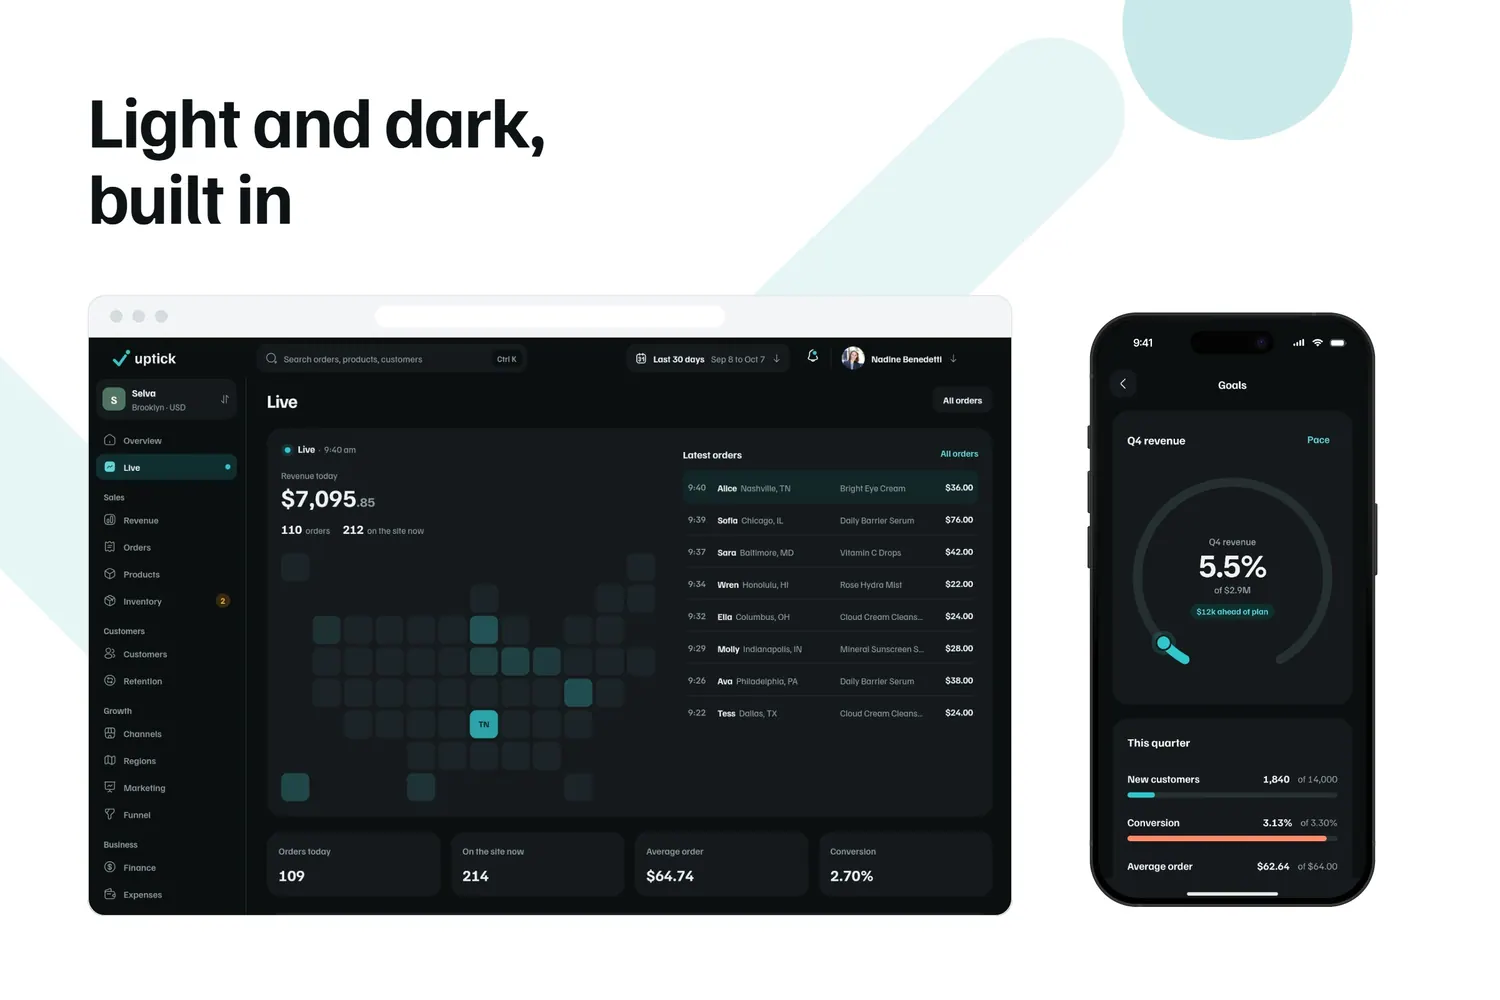
What Uptick includes
- OverviewFour numbers that switch the chart and the quarter's goal
- SalesRevenue by period, a growth and margin matrix and inventory
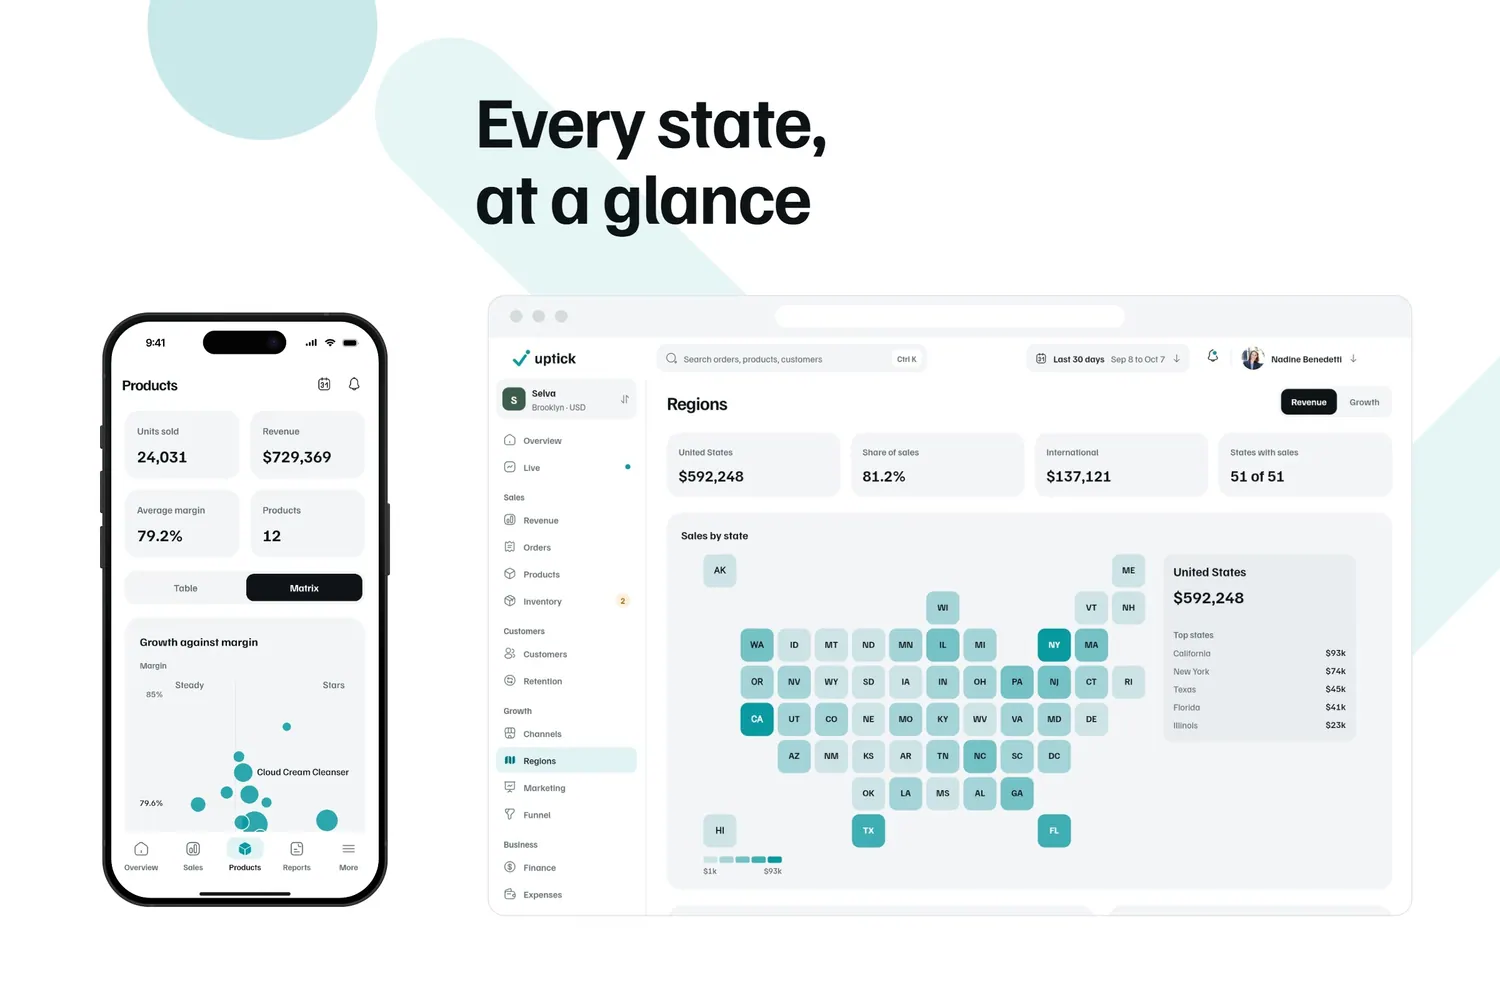
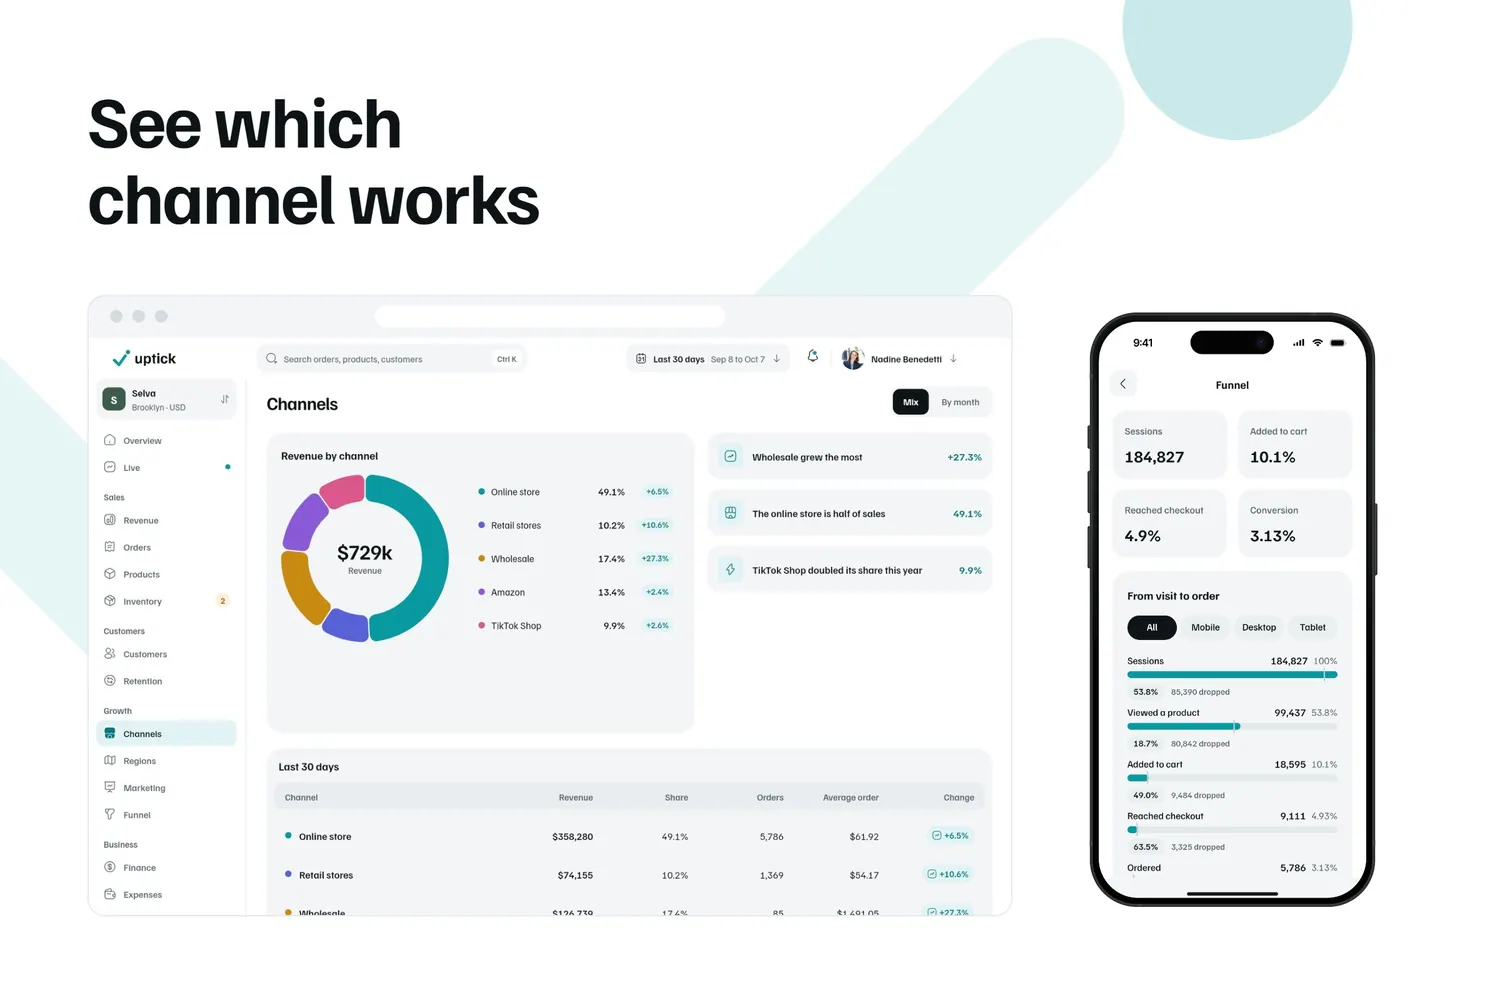
- GrowthSales by US state on a tile map and the conversion funnel
- ReportsA report builder with live preview, export and schedules
Uptick is a sales analytics and business owner dashboard for online stores and brands that sell in many places: revenue, orders, products, channels, states, marketing, finance, the team and goals, as a responsive web dashboard that also works on phones.
What's inside
- 52 pages and 27 components, light and dark
- Overview: four numbers that switch the chart, revenue against the last period, today live, the quarter's goal
- Sales: revenue by day, week or month, gross to net, orders, products (table or growth and margin matrix), inventory with days of stock
- Customers: new and returning, best customers, retention cohorts
- Growth: channel mix, sales by US state on a tile map, marketing and campaigns, the conversion funnel by device, when people buy
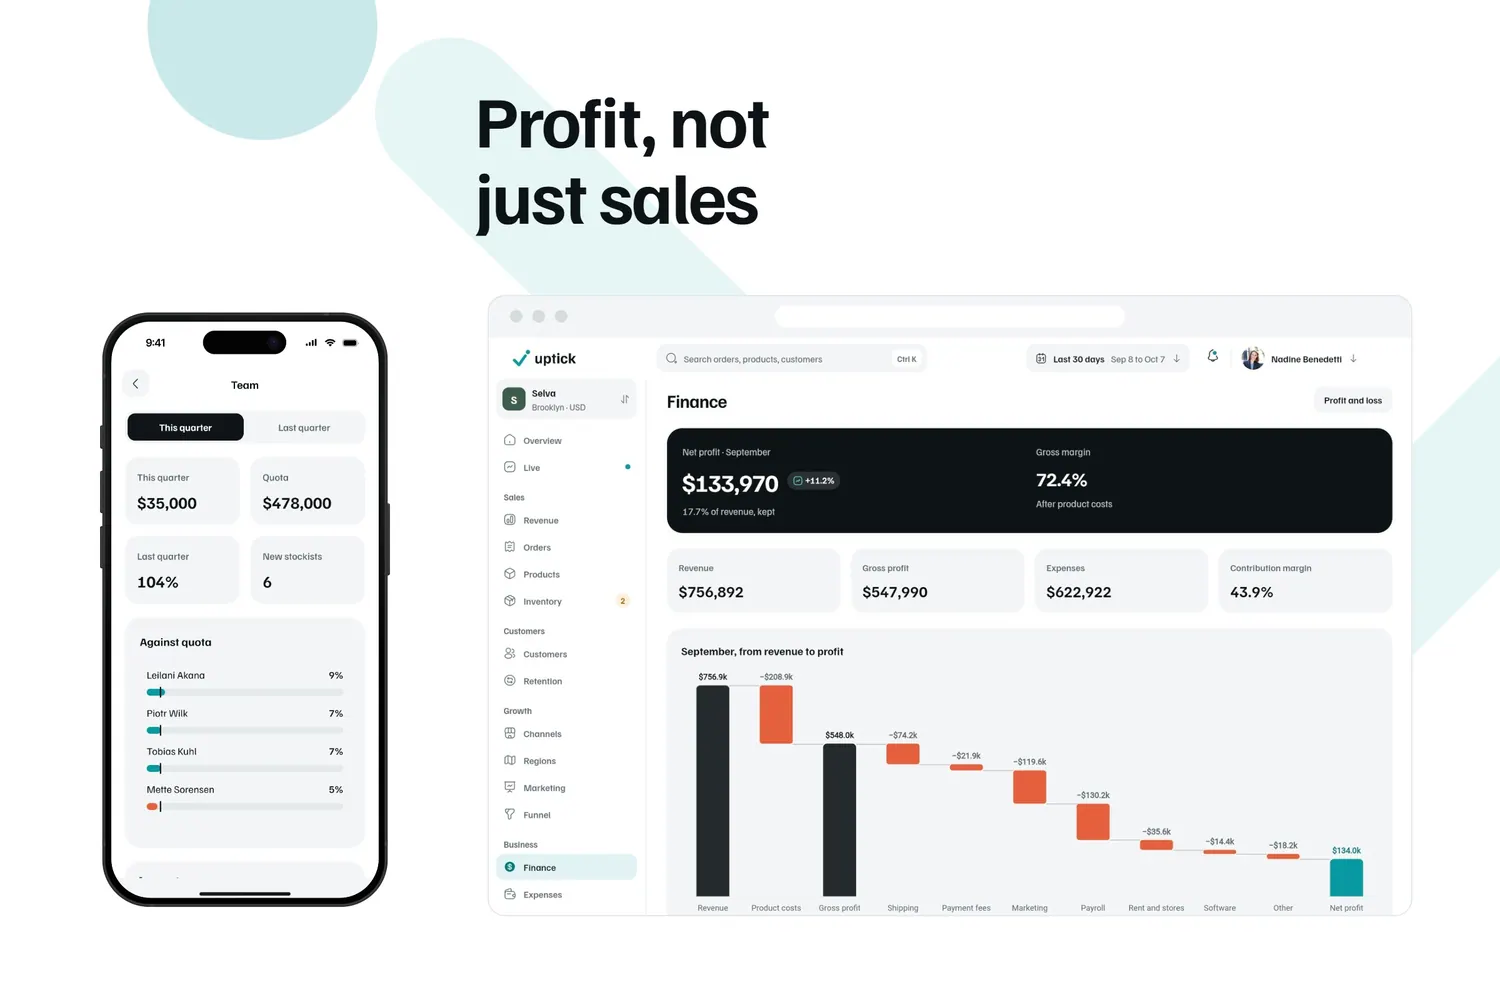
- Business: profit and loss bridge, expenses against budget, the team against quota, goals with pacing
- Reports: the Q3 report, a report builder with live preview, export (PDF, CSV, Excel, Sheets), schedules
- 17 custom widgets, from TrendChart and StateTileMap to RangePicker and ReportBuilder
Design
A sidebar from 1024 px, a navbar on phones. One teal for growth on white, Familjen Grotesk, Iconsax.
Good to know
A UI template with sample content. Connect your own backend.





Need it built for you?
Start from Uptick and we'll take it the rest of the way: your brand, your backend, live in the stores.
Start a project